Debugging a rustc segfault on illumos
Table of contents
At Oxide, we use Helios as the base OS for the cloud computers we sell. Helios is a distribution of illumos, a Unix-based operating system descended from Solaris.
As someone who learned illumos on the job, I’ve been really impressed by the powerful debugging tools it provides. I had a chance to use some of them recently to track down a segmentation fault in the Rust compiler, with the help of several of my colleagues. I learned a lot from the process, and I thought I’d write about it!
I’m writing this post for an audience of curious technologists who aren’t necessarily familiar with systems work. If you’re an experienced systems developer, parts of it are likely familiar to you—feel free to skip over them.
The crash#
A couple of weeks ago, I wanted to make a change to the Rust standard library on illumos. I logged
into my illumos box and cloned the Rust repository (revision
2d5a628). Following the setup
instructions, I configured the rustc build system with the library build profile.
When I went to run ./x.py check, I saw an error with the following output:
$ ./x.py check
Checking stage0 cranelift (x86_64-unknown-illumos)
    Checking cranelift-codegen v0.109.0
rustc exited with signal: 11 (SIGSEGV) (core dumped)
error: could not compile `cranelift-codegen` (lib)

Caused by:
  process didn't exit successfully: ...
Build completed unsuccessfully in 0:00:03
Quite concerning! Like any good technologist I tried running the command again. But the segfault
seemed to be completely deterministic: the program would crash while compiling cranelift-codegen
every time.
Coincidentally, we had our fortnightly “Rust @ Oxide” virtual meetup at around that time. There wasn’t much to discuss there, so we turned that meeting into a debugging session. (I love how my coworkers get excited about debugging strange issues.)
Background: the bootstrap process#
Like the compilers for many other languages, the Rust compiler is written in the language it is intending to compile (in this case, Rust). In other words, the Rust compiler is self-hosting.
Any self-hosting compiler needs to answer the question: how in the world do you compile the compiler if you don’t already have a working compiler? This is known as the bootstrapping problem. There are several ways to address the problem, but the two most common are:
Use the previous version of the compiler. In other words, use version N-1 of the compiler to compile version N. For example, use Rust 1.75 to compile Rust 1.76.
From where do you begin, though?
The earliest versions of Rust were written in Ocaml. So if you’re spinning up Rust on a brand new platform and have an Ocaml compiler available, you can actually start from there and effectively create your own lineage of compilers.
There are also implementations of Rust in other languages, like
mrustcin C++, which can be used to build some (typically pretty old) version of the compiler. Interestingly, these other implementations don’t need to be perfect—for example, since they’re only used to compile code that’s known to be valid, they don’t need to handle errors well. That’s a large chunk of the complexity of a real compiler.Cross-compile from another platform. As a shortcut, if you have a way to cross-compile code from another platform, you can use that to set up the initial compiler. This is the most common method for setting up Rust on a new platform. (But note that method 1 must be used on at least one platform.)
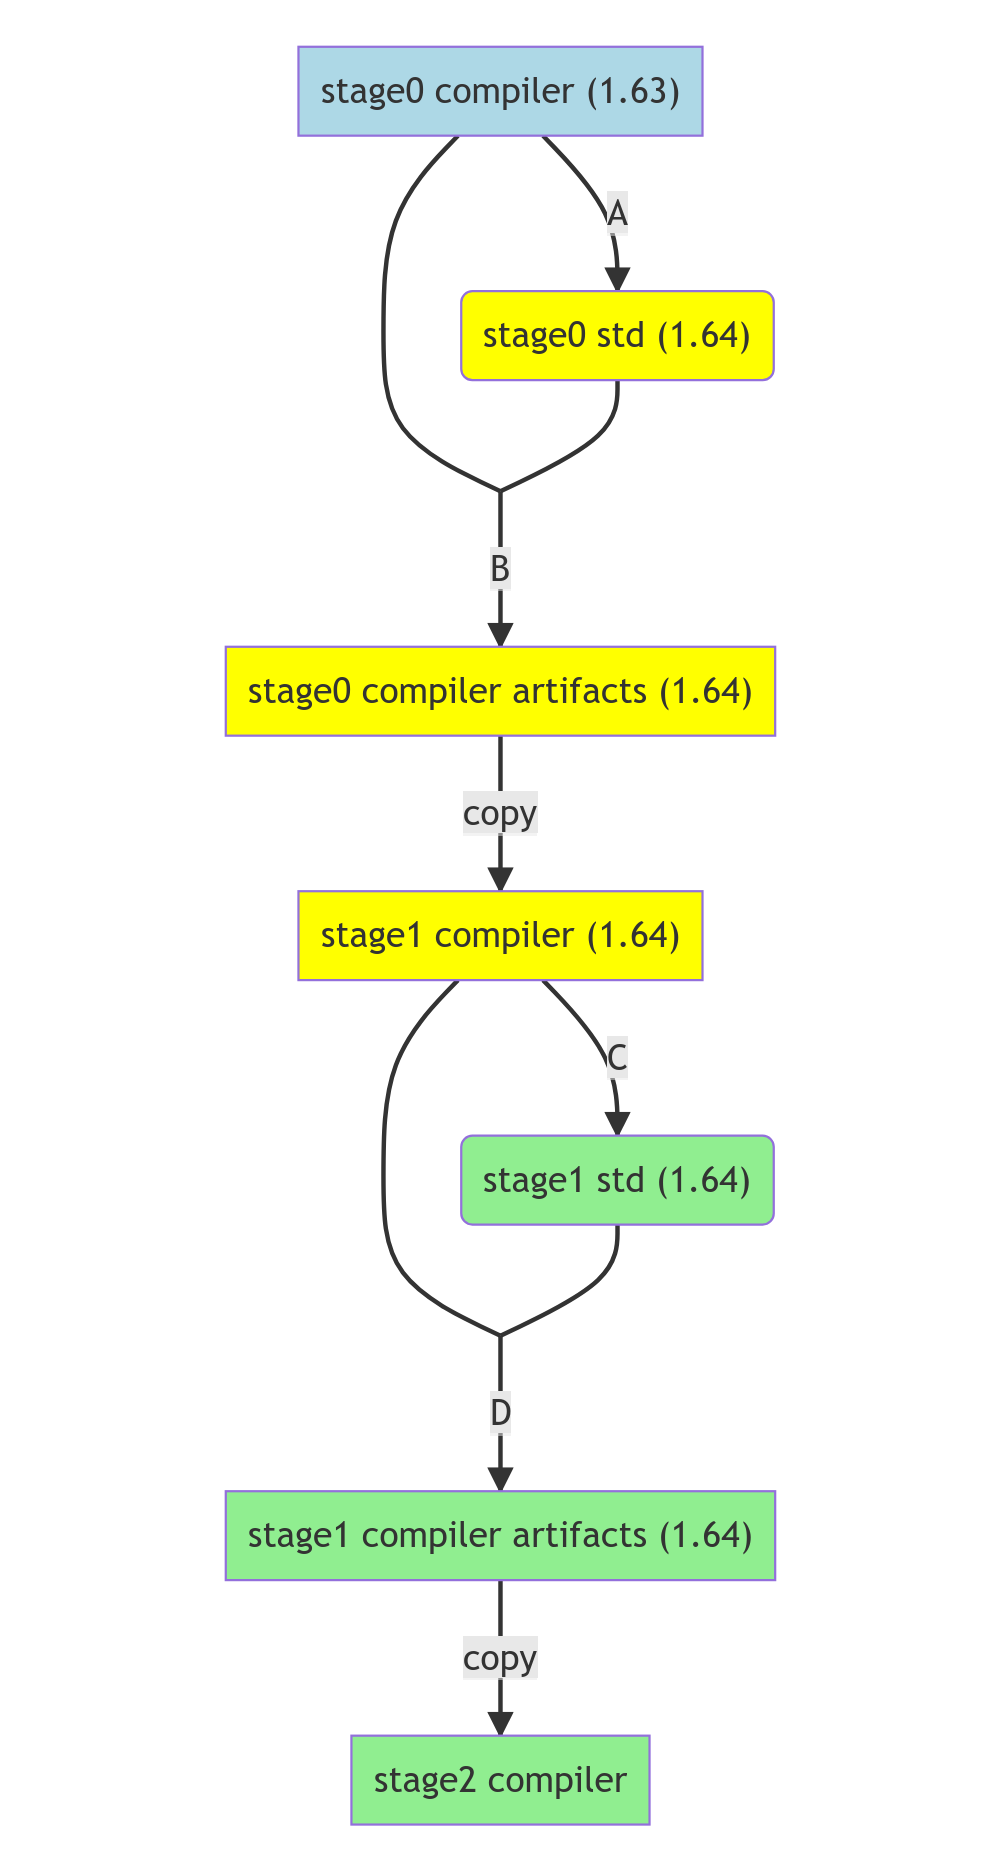
While bootstrapping from the previous version of Rust, the toolchain follows a series of stages, ranging from stage 0 to stage 2.
In our case, since we’re working with the standard library we’re only concerned with stage 0: the
standard library compiled with the previous version of rustc. That is the build process that crashed.
Orienting ourselves#
The first thing to find is the version of rustc that’s crashing. There are a few ways to find the compiler, but a simple find command works well:
$ find . -name rustc
./compiler/rustc
./src/doc/rustc
./build/x86_64-unknown-illumos/stage0/bin/rustc
This command finds rustc at ./build/x86_64-unknown-illumos/stage0/bin/rustc. Let’s ask it for its version:
$ ./build/x86_64-unknown-illumos/stage0/bin/rustc -Vv
rustc 1.80.0-beta.1 (75ac3b633 2024-06-10)
binary: rustc
commit-hash: 75ac3b6331873133c4f7a10f2252afd6f3906c6a
commit-date: 2024-06-10
host: x86_64-unknown-illumos
release: 1.80.0-beta.1
LLVM version: 18.1.7
Can the bug be reproduced independently of the Rust toolchain? The toolchain does all sorts of
non-standard things, so it’s worth checking. The output says cranelift-codegen v0.109.0, so let’s try building that separately. Again, there are a few ways to do this, but the easiest is to make a simple Cargo project that depends on the crate.
[package]
name = "cranelift-codegen-test"
version = "0.1.0"
edition = "2021"

[dependencies]
cranelift-codegen = "=0.109.0"
And then run cargo build. I didn’t have rustc 1.80.0 beta 1 on the machine, so I tried with the 1.80.0 release:
$ cargo +1.80.0 build
   Compiling cranelift-codegen v0.109.0
error: could not compile `cranelift-codegen` (lib)

Caused by:
  process didn't exit successfully: `/home/rain/.rustup/toolchains/1.80.0-x86_64-unknown-illumos/bin/rustc ...` (signal: 11, SIGSEGV: invalid memory reference)
Yep, it crashes in the same spot.
This is a minimal-enough example, so let’s work with this.
Finding the core file#

When a program crashes, systems are typically configured to generate a core dump, also known as a core file. The first step while debugging any crash is to ensure that core dumps are generated, and then to find one to examine it.
On illumos, many of the system-level administration tools are called <something>adm. The tool for managing core files is called coreadm. Let’s run that:
$ coreadm
     global core file pattern:
     global core file content: default
       init core file pattern: core
       init core file content: default
            global core dumps: disabled
       per-process core dumps: enabled
      global setid core dumps: disabled
 per-process setid core dumps: disabled
     global core dump logging: disabled
This suggests that core “per-process core dumps” are enabled. The lack of a pattern indicates that the defaults are used. Generally, on Unix systems the default is to generate a file named core in the current directory of the crashing process.
A simple ls in our little test project doesn’t show a core file, which means that it might be elsewhere. Let’s just do a global find for it.
$ find / -name core -type f
This showed a few files on my system, including: ~/.cargo/registry/src/index.crates.io-6f17d22bba15001f/cranelift-codegen-0.109.0/core. Bingo! That looks like a hit. (Why is it in the registry? Because when compiling a crate, Cargo sets the current working directory of the child rustc process to the crate’s directory.)
The next step is to move the file into another directory1. After doing that, let’s start examining it.
Examining the core file: registers and call stack#
The best way to examine a core file on illumos is with the Modular Debugger, mdb. mdb is a powerful tool that can be used to inspect the state of both live and dead processes, as well as the kernel itself.
Using mdb with the core file is simple: just run mdb core.
$ mdb core
Loading modules: [ libumem.so.1 libc.so.1 ld.so.1 ]
>
The first step is to enable symbol demangling2. The command to do that in mdb is $G, so let’s run that:
> $G
C++ symbol demangling enabled
(The output says “C++”, but illumos’s demangler can handle Rust symbols, too.)
Let’s look at the CPU registers now. A register stores a small amount of data that the CPU can access very quickly. Core files typically have the contents of registers at the time of the crash, which can be very useful for debugging.
In mdb, the command to print out registers is $r or ::regs. Here’s the output:
> $r
%rax = 0x000000000fb0d460       %r8  = 0x0000000001000000
%rbx = 0x0000000000000000       %r9  = 0x0000000000000000
%rcx = 0x0000000000000000       %r10 = 0x0000000000000010
%rdx = 0x0000000000000001       %r11 = 0x0000000000000286
%rsi = 0x000000000fb0d3d0       %r12 = 0x0000000000000d96
%rdi = 0xfffffc7fed8e5f30       %r13 = 0x0000000000000000
                                %r14 = 0x000000000fb0d3d0
                                %r15 = 0xfffffc7fed8e6200

%cs = 0x0053    %fs = 0x0000    %gs = 0x0000
%ds = 0x004b    %es = 0x004b    %ss = 0x004b

%rip = 0xfffffc7fd1adc4bb librustc_driver-86178b5e8d46877c.so`<rustc_parse::parser::Parser>::parse_path_segment+0x7b
%rbp = 0xfffffc7fed8e6140
%rsp = 0xfffffc7fed8e5c20

%rflags = 0x00010216
  id=0 vip=0 vif=0 ac=0 vm=0 rf=1 nt=0 iopl=0x0
  status=<of,df,IF,tf,sf,zf,AF,PF,cf>

%gsbase = 0x0000000000000000
%fsbase = 0xfffffc7fee830a80
%trapno = 0xe
   %err = 0x6
All right, there’s a lot going on here. A full accounting of the registers on x86-64 is beyond the scope of this post, but if you’re interested here’s a quick summary. The most important registers here are %rip, %rsp, and %rbp. All three of these are 64-bit addresses.
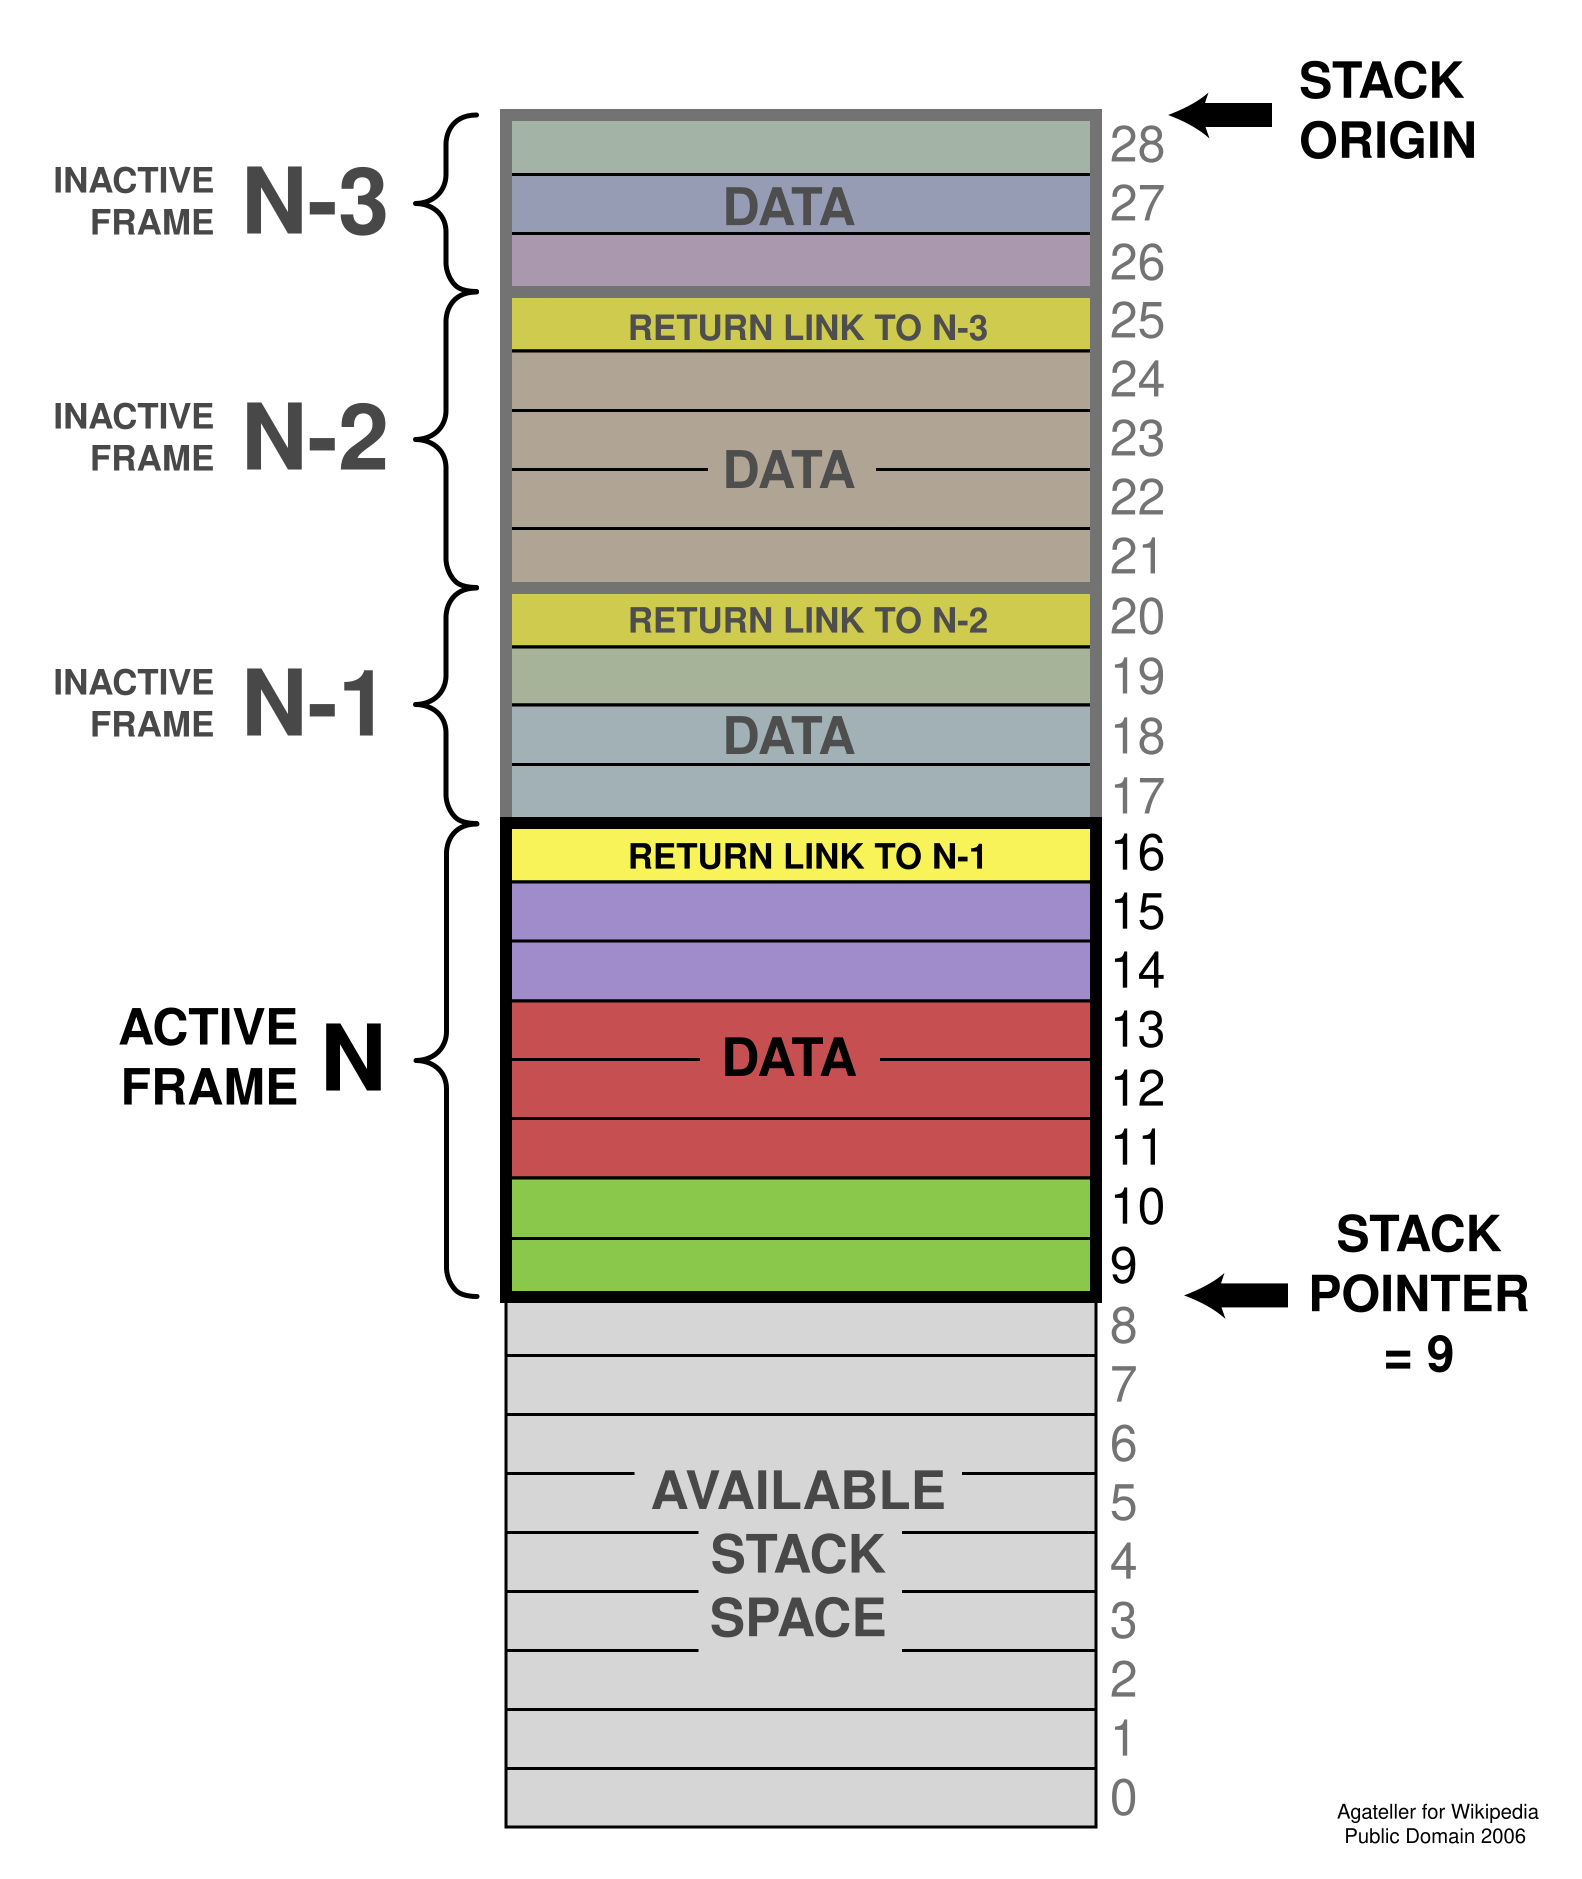
%ripis the instruction pointer, also known as the program counter.%ripis a special register that points to the next instruction to be executed. The CPU uses to keep track of where it is in the program.%rspis the stack pointer. The call stack is a region of memory that is used to store function call information and local variables. The stack pointer points to the head of the stack.Note that on most architectures including x86-64, the stack grows down in memory: when a function is called, a new stack frame is set up and the stack pointer is decremented by however much space the function needs.
%rbpis the base pointer, more commonly known as the frame pointer. It points to the base of the current stack frame3.
We can also look at the call stack via the $C command. The stack turns out to be enormous (full output):
> $C ! wc -l
1493
> $C
fffffc7fed8e6140 librustc_driver-86178b5e8d46877c.so`<rustc_parse::parser::Parser>::parse_path_segment+0x7b()
<... snipped ...>
(The ! is used to send the output to a shell command, in this case one that counts the number of lines.)
It looks like the crash is in the rustc parser. (Notably, the crash is while compiling a crate called cranelift-codegen, which suggests automatic code generation. Generated code often tends to stress the parser in ways that manually written code does not.)
Based on the call stack, it looks like the rustc parser is recursive in nature. A quick Google
search
confirms that
the rustc parser is a “simple hand-written recursive descent parser”. This isn’t surprising, since
most production parsers are written this way. (For example, syn is also a
recursive descent parser.)
Turning our attention to the instruction pointer fffffc7fd1adc4bb, we can use the ::dis command to disassemble the function at that address. (Full output; the -a flag ensures that addresses are not converted to very long function names.)
> fffffc7fd1adc4bb::dis -a
<... snipped ...>
fffffc7fd1adc4b6                movl   $0x1,%edx
fffffc7fd1adc4bb                call   +0x1caf0 <librustc_driver-86178b5e8d46877c.so`<rustc_parse::parser::Parser>::parse_ident_common>
fffffc7fd1adc4c0                cmpl   $0x0,0xfffffffffffffdf0(%rbp)
<... snipped ...>
So it looks like the crash is happening in a call instruction to another function,
parse_ident_common.
(Keep in mind that this information could be completely unreliable! The stack might be corrupted, the registers might be wrong, and so on. But it’s what we have for now.)
Examining the address space#
On virtual memory systems, which includes all modern desktop and server systems, each process gets the illusion that it has a very large amount of memory all to itself. This is called the address space of a process. The instructions, the call stack, and the heap all get their own regions of addresses in that space, called memory mappings. The 64-bit addresses that we saw earlier are all part of the address space.
mdb has a command called whatis to look up which part of memory an address is at. Let’s look at the stack pointer first:
> fffffc7fed8e5c20::whatis
fffffc7fed8e5c20 is in [ unknown ] [fffffc7fed8e5000,fffffc7fed8e6000)
This tells us that the address is in the range 0xfffffc7fed8e5000 to 0xfffffc7fed8e6000. This is
a small 4 KiB range.
What about the frame pointer?
> fffffc7fed8e6140::whatis
fffffc7fed8e6140 is in [ unknown ] [fffffc7fed8e6000,fffffc7fed9e7000)
This appears to be in a different range.
In this case, the ending address is fffffc7fed9e7000 (note the 9e, not the 8e!). This address
is 0x101000 bytes away from the starting address. That is equal to 1028 KiB, or 1 MiB + 4 KiB page4.
Something else that’s relevant here is what permissions each range of addresses has. Like files on Unix, a block of virtual memory can have read, write, or execute permissions. (In this case, execute means that it is valid for the instruction pointer to point here5.)
On illumos, a tool called pmap can show these spaces. pmap works on both live processes and core files. Running pmap core shows the permissions for the addresses we’re interested in (full output):
$ pmap core
<... snipped ..>
FFFFFC7FED8E5000          4K -----    [ anon ]
FFFFFC7FED8E6000       1028K rw---    [ anon ]
<... snipped ..>
The 1028 KiB range is read-write, and the 4 KiB range above that doesn’t have any permissions whatsoever.
This would explain the segfault. A segfault is an attempt to operate on a part of memory that the program doesn’t have permissions for. Attempting to read from or write to memory which has no permissions is an example of that.
Formulating a theory#
At this point, we have enough information to come up with a theory:
- The thread had a call stack of 1028 KiB available to it, starting at
fffffc7fed8e6000. - The call stack pointer was at
fffffc7fed8e6140(only0x140= 320 bytes away), and it tried to create a frame of size0x520(1312) bytes, atfffffc7fed8e5c20. - This caused the call stack to be exhausted: the thread ran out of space6.
- When the thread ran out of space, it indexed into a 4 KiB section known as a guard page. The thread did not have any permissions to operate on the page, and was in fact designed to cause a segfault if accessed in any way.
- The program then (correctly) segfaulted.
But there are also other bits of evidence that this theory doesn’t explain, or even cuts against. (This is what makes post-mortem debugging exciting! There are often contradictory-seeming pieces of information that need to be explained.)
The memory is marked
anonorunknown. That’s not how call stacks are supposed to be marked! In thepmapoutput, there’s a line which says:FFFFFC7FED7B1000 316K rw--- [ stack tid=3 ]So you’d expect call stacks to be marked with
[ stack tid=<something> ], not[ anon ].Why is the size of the allocation 1028 KiB? You’d generally expect stack sizes to be a round power of two.
Isn’t 1028 KiB kind of small? The thread is a non-main thread, and the default stack size for Rust threads is 2 MiB. Why is our thread ~1 MiB and not 2 MiB?
How are call stack sizes determined?
On Unix platforms, for the main thread, the call stack size is determined by
ulimit -s(in KiB). On my illumos machine, this printed10240, indicating a 10 MiB call stack.For child threads, the call stack size is determined by whatever created them. For Rust, the default is 2 MiB.
Why doesn’t this crash happen on other platforms? If this is a crash in the
rustcparser, one would ordinarily expect it to arise everywhere. Yet it doesn’t seem to occur on Linux, macOS, or Windows. What’s special about illumos?Setting
RUST_MIN_STACKdoesn’t help. Rust-created thread stack sizes can be configured via theRUST_MIN_STACKenvironment variable. If we try to use that:$ RUST_MIN_STACK=$((4 * 1024 * 1024)) cargo buildIt turns out that
rustccrashes at exactly the same spot. That’s really strange!It is possible that the stack size was overridden at thread creation time. The documentation for
RUST_MIN_STACKsays: “Note that settingBuilder::stack_sizewill override this.” But that seems unlikely.
A closer look at the call stack#
Looking towards the bottom of the call stack, there’s something really strange:
fffffc7fed9e5f80 librustc_driver-86178b5e8d46877c.so`rustc_query_system::query::plumbing::try_execute_query...
fffffc7fed9e5fd0 librustc_driver-86178b5e8d46877c.so`stacker::grow::<rustc_middle::query::erase::Erased<[u8; 16]>, ...>
fffffc7fed9e5ff0 librustc_driver-86178b5e8d46877c.so`psm::on_stack::with_on_stack...
fffffc7fed7e4960 librustc_driver-86178b5e8d46877c.so`rust_psm_on_stack+9()
fffffc7fed7e4a20 librustc_driver-86178b5e8d46877c.so`stacker::_grow+0x13e()
fffffc7fed7e4ad0 librustc_driver-86178b5e8d46877c.so`rustc_query_impl::query_impl::resolver_for_lowering_raw::get_query_non_incr...
Notice the jump in addresses from fffffc7fed7e4960 to fffffc7fed9e5ff0? Normally, stack addresses are decremented as new functions are called: the number goes down. In this case the stack address is incremented. The number went up. Strange.
Also notice that this coincides with the use of a function called stacker::_grow. Now that’s a real lead!
What part of memory is fffffc7fed7e4960 in? mdb says:
> fffffc7fed7e4960::whatis
fffffc7fed7e4960 is in [ stack tid=3 ]
So this address is part of the stack for thread 3. pmap agrees:
FFFFFC7FED7B1000 316K rw--- [ stack tid=3 ]
What is stacker? Time for some googling! Per the documentation, stacker is:
A library to help grow the stack when it runs out of space.
This is an implementation of manually instrumented segmented stacks where points in a program’s control flow are annotated with “maybe grow the stack here”. Each point of annotation indicates how far away from the end of the stack it’s allowed to be, plus the amount of stack to allocate if it does reach the end.
Because the rustc parser is recursive, it is susceptible to call stack exhaustion. The use of stacker is supposed to prevent, or at least mitigate, that.
How does stacker work? The library has a pretty simple API:
pub fn maybe_grow<R, F: FnOnce() -> R>(
    red_zone: usize,
    stack_size: usize,
    callback: F,
) -> R { ... }

The developer is expected to intersperse calls to maybe_grow within their recursive function. If less than red_zone bytes of stack space remain, stacker will allocate a new segment of stack_size bytes, and run callback with the stack pointer pointing to the new segment.
How does rustc use stacker? The code is in this file. The code requests an additional 1 MiB stack with a red zone of 100 KiB.
Why did stacker create a new stack segment? In our case, the call is at the very bottom of the stack, when plenty of space should be available, so ordinarily stacker should not need to allocate a new segment. Why did it do so here?
The answer is in stacker’s source code. There is code to guess the stack size on many platforms. But it isn’t enabled on illumos: guess_os_stack_limit always returns None.
Putting it together#
With this information in hand, we can flesh out our call stack exhaustion theory:
Some file in
cranelift-codegenwas triggering the crash by requiring more than 1 MiB of stack space.- The
rustcparser running againstcranelift-codegenneeded more than 1 MiB of stack space, but less than 2 MiB.
- The
Had this bug occurred on other platforms like Linux, this issue would have been a showstopper. However, it wasn’t visible on those platforms because:
- Threads created by Rust use a 2 MiB stack by default.
rustcrequested thatstackercreate a 1 MiB stack segment, but only if less than 100 KiB of stack space was left.- On the other platforms,
stackercould see that well over 100 KiB of stack space was left, and so it did not allocate a new segment. - On illumos,
stackercould not see how much stack was left, and so it allocated a new 1 MiB segment. - This 1 MiB stack was simply not enough to parse
cranelift-codegen.
rustcdidn’t callstacker::maybe_growenough! In order for it to work,stackerneeds to be interspersed throughout the recursive code. But some recursive parts did not appear to have called it.
(It is somewhat ironic that stacker, a library meant to prevent call stack exhaustion, was actively making life worse here.)
Where does the 1028 KiB come from? Looking at the stacker source code:
let page_size = page_size();
let requested_pages = stack_size
    .checked_add(page_size - 1)
    .expect("unreasonably large stack requested") / page_size;
let stack_pages = std::cmp::max(1, requested_pages) + 2;
let stack_bytes = stack_pages.checked_mul(page_size)
    .expect("unreasonably large stack requesteed");
It looks like stacker first computes the number of requested pages by dividing the requested stack size by the page size, rounding up. Then it adds 2 to that. In our case:
- The requested stack size is 1 MiB.
- With 4 KiB pages, this works out to 256 pages.
stackerthen requests 256 + 2 = 258 pages, which is 1032 KiB.
This explains both the 1028 KiB allocation (one guard page after the stack), and the 4 KiB guard page we’re crashing at (one guard page before the stack).
Triggering the bug on other platforms#
If the issue is that a 1 MiB stack isn’t enough, it should be possible to reproduce this on other platforms by setting their stack size to something smaller than the 2 MiB default.
With a stack size <= 1 MiB, we would expect that:
rustccallsstackeras before.- There are two possibilities: either
stackerdecides there is enough stack space and doesn’t create a new segment, or it decides there isn’t enough and does create a new 1 MiB segment. - In either case, 1 MiB is simply not enough to parse
cranelift-codegen, and the program crashes.
Let’s try to compile cranelift-codegen on Linux with a reduced stack size.
$ cd cranelift-codegen-test
$ RUST_MIN_STACK=1048576 cargo +1.80.0 build

note: rustc unexpectedly overflowed its stack! this is a bug
note: maximum backtrace depth reached, frames may have been lost
note: we would appreciate a report at https://github.com/rust-lang/rust
help: you can increase rustc's stack size by setting RUST_MIN_STACK=2097152
note: backtrace dumped due to SIGSEGV! resuming signal
This does crash as expected. The full output is here. Some of the symbols are missing, but the crash does seem to be in parser code.
(At this point, we could have gone further and tried to make a debug-assertions build of rustc – but it was already pretty clear why the crash was happening.)
What code’s failing to parse, anyway?#
Call stack exhaustion in the parser suggests that the crash is happening in some kind of large, automatically generated file. But what file is it?

It’s hard to tell by looking at the core file itself, but we have another dimension of debugging at hand: syscall tracers! These tools print out all the syscalls made by a process. Most OSes have some means to trace syscalls: strace on Linux, dtruss on macOS, Process Monitor on Windows, and truss on illumos7.
Since we’re interested in file reads, we can try filtering it down to the open and openat syscalls. You need to open a file to read it, after all. (Alternatively, we can also simply not filter out any syscalls, dump the entire trace to a file, and then look at it afterwards.)
On illumos, we tell truss to run cargo build, filtering syscalls to open and openat (-t), and following child processes (-f):
$ truss -ft open,openat cargo build
This prints out every file that the child rustc tries to open (full output):
20755/3:	open("/home/rain/dev/cranelift-codegen-test/target/debug/build/cranelift-codegen-dad37ce046df129a/out/isle_opt.rs", O_RDONLY|O_CLOEXEC) = 13
20755/3:	    Incurred fault #6, FLTBOUNDS  %pc = 0xFFFFFC7FD9E74361
20755/3:	      siginfo: SIGSEGV SEGV_ACCERR addr=0xFFFFFC7FED22CA58
20755/3:	    Received signal #11, SIGSEGV [default]
20755/3:	      siginfo: SIGSEGV SEGV_ACCERR addr=0xFFFFFC7FED22CA58
20754/3:	    Received signal #18, SIGCLD, in waitid() [default]
20754/3:	      siginfo: SIGCLD CLD_DUMPED pid=20755 status=0x000B
It looks like the crash is in a file called isle_opt.rs in the out/ directory. With Cargo, a file being in an out/ directory is a pretty strong indication that it is generated by a build script.
On Linux, a similar strace command is:
RUST_MIN_STACK=1048576 strace -fe open,openat cargo build
This command also blames the same file, isle_opt.rs.
What does this file look like, anyway? Here’s my copy. It’s pretty big and deeply nested! It does look large and complex enough to trigger call stack exhaustion.
Syscall traces would definitely be somewhat harder to get if the crash weren’t so easily reproducible. Someone smarter than me should write about how to figure this out using just the core file. The file’s fully loaded into memory so it seems like it should be possible.
Unblocking myself#
Going back to the beginning: the reason I went down this adventure was because I wanted to make an unrelated change to the Rust standard library. But the stage 0 compiler being broken meant that it was impossible to get to the point where I could build the standard library as-is, let alone test that change.
How can we work around this? Well, going back to basics, where did the stage 0 compiler come from? It came from Rust’s CI, and it wasn’t actually built on illumos! (Partly because there’s no publicly-available CI system running illumos.) Instead, it was cross-compiled from Linux to illumos.
Based on this, my coworker Joshua suggested that I try and do whatever Rust’s CI does to build a stage 0 compiler for illumos.
Rust’s CI uses a set of Docker images to build distribution artifacts. In theory, building a patched rustc should be as simple as running these commands on my Linux machine:
# Check out the exact version of the stage0 compiler
$ git checkout 75ac3b633

# Make changes...

# Run Docker build
$ ./src/ci/docker/run.sh dist-x86_64-illumos
In reality, there were some Docker permissions issues due to which I had to make a couple of changes to the script. Overall, though, it was quite simple. Here’s the patch I built the compiler with, including the changes to the CI scripts.
The result of building the compiler was a set of .tar.xz files, just like the ones published by Rust’s CI. After copying the files over to my illumos machine, I wasn’t sure which tarballs to extract. So I made a small change to the bootstrap script to use my patched tarballs.
With this patch, I was able to successfully build Rust’s standard library on illumos and test my changes. Hooray! (Here’s what I was trying to test.)
Update 2024-08-05: After this post was published, jyn pointed out on Mastodon that cranelift-codegen is actually optional, and that I could have also worked around the issue by disabling it in the rustc build system’s config.toml. Thanks!
What did we learn?#
The bug occurred due to a combination of several factors. It also revealed a few other issues, such as the lack of an environment variable workaround and some missing error reporting.
Here are some ways we can make the situation better, and help us have an easier time debugging similar issues in the future.
rustcisn’t usingstackerenough. The basic problem underneath it all is that the part of therustcparser that triggered the bug wasn’t callingstackeroften enough to make new stack segments.rustcshould be callingstackermore than it is today.- Filed as rust-lang/rust#128422.
stackercannot detect the stack size on illumos. This is something that we should fix instacker, but this is actually a secondary issue here. On other platforms,stacker’s ability to detect the stack size was masking therustcbug.Fixing this requires two changes:
- A PR to
libcto add thepthread_attr_get_npfunction to it. - A PR to
stackerto use this function to detect the stack size on illumos.
- A PR to
stacker-created segments don’t print a nice message on stack exhaustion. This is a bit ironic becausestackeris supposed to prevent stack exhaustion. But when it does happen, it would be nice ifstackerprinted out a message like standard Rust does.- This is rust-lang/stacker#59.
On illumos, the Rust runtime doesn’t print a message on stack exhaustion. Separate from the previous point, on illumos the Rust runtime doesn’t print a message on stack exhaustion even when using native stacks.
- Filed as rust-lang/rust#128568.
Rust’s CI doesn’t run on illumos. At Oxide, we have an existential dependency on Rust targeting illumos. Even a shadow CI that ran on nightly releases would have caught this issue right away.
We’re discussing the possibilities for this internally; stay tuned!
stackersegment sizes can’t be controlled via the environment. Being able to control stack sizes withRUST_MIN_STACKis a great way to work around issues. It doesn’t appear thatstackersegment sizes can be controlled in this manner. Maybe that functionality should be added torustc, or tostackeritself?- Opened a discussion on internals.rust-lang.org.
Maybe a crater run with a smaller stack size? It would be interesting to see if there are other parts of the Rust codebase that need to call
stackermore as well.x.pysuggests disabling optional components. Sincecranelift-codegenwas an optional component that can be disabled, thex.pytooling could notice if a build failed in such a component, and recommend disabling that component. Added 2024-08-05, suggested by jyn.
To me, this is the most exciting part of debugging: what kinds of changes can we make, both specific and systemic ones, to make life easier for our future selves?
Conclusion and credits#
This was a really fun debugging experience because I got to learn about several illumos debugging tools, and also because we could synthesize information from several sources to figure out a complex issue. (Thankfully, the root cause was straightforward, with no memory corruption or other “spooky action at a distance” involved.)
Debugging this was a real team effort. I couldn’t have done it without the assistance of several of my exceptional colleagues. In no particular order:
Thanks to all of you!
I neglected to do this during my own debugging session, which led to some confusion when I re-ran the process and found that the core file had been overwritten. ↩︎
Name mangling is a big topic of its own, but the short version is that the Rust compiler uses an algorithm to encode function names into the binary. The encoding is designed to be reversible, and the process of doing so is called demangling. (Other languages like C++ do name mangling, too.) ↩︎
You might have heard about “frame pointer omission”, which is a technique to infer the base of stack frames rather than storing it in
%rbpexplicitly. In this case, the frame pointer is not omitted. ↩︎A page is the smallest amount of physical memory that can be atomically mapped to virtual memory. On x86-64, the page size is virtually always 4 KiB. ↩︎
Memory being both writable and executable is dangerous, and modern systems do not permit this by default for security reasons. Some platforms like iOS even make it impossible for memory to be writable and executable, unless the platform holder gives you the corresponding permissions. ↩︎
This is generally known as a “stack overflow”, but that term can also mean a stack-based buffer overflow. Throughout this document, we use “call stack exhaustion” to avoid confusion. ↩︎
There is likely some way to get
rustcitself to print out which files it opened, but the beauty of system call tracers is that you don’t need to know anything about the program you’re tracing. ↩︎